Most WordPress site owners assume that once they install a few analytics or performance plugins, they have a clear picture of how the site is doing.
To be fair, those tools help. They show page speed scores, visitor behavior, database activity, and other useful signals from inside WordPress. But that’s only part of the story.
When a site suddenly slows down, throws errors, or struggles during a traffic spike, plugin-based analytics often can’t explain the real cause. They show what’s happening inside the application, but they usually can’t see what’s happening at the hosting layer, where requests are handled.
That gap matters more than many site owners realize. If you’re trying to figure out why page speed dropped or why errors appeared out of nowhere, surface-level metrics won’t always get you there. You need visibility into the WordPress environment and the infrastructure supporting it.
In this article, we look at what plugins can and can’t show, why hosting-level visibility gives you a clearer view of site performance and reliability, and how using both perspectives together leads to smarter WordPress management.
Visibility matters when managing WordPress sites
In most cases, site owners ask questions like:
- Why did page speed suddenly drop even though nothing major was changed?
- Why did a campaign or social spike push the site into slow response times?
- Why are server errors appearing on pages that seemed fine yesterday?
Those aren’t surface-level questions, so surface-level metrics usually won’t be enough to answer them.
To get real clarity, you need to think in terms of two different layers of visibility. The first is application-level visibility, which includes WordPress plugins, analytics tools, and diagnostics that show what’s happening inside the site. The second is infrastructure-level visibility, which includes the hosting environment handling requests, caching, server resources, and traffic behavior before WordPress even has a chance to respond.
Once you separate those two layers, troubleshooting gets a lot easier. You stop treating every slowdown or error as a mystery within WordPress alone and start looking at the full environment that supports the site.
What plugin-based analytics actually measure
Most WordPress analytics and performance plugins work from inside the WordPress application. They track what happens after WordPress is already running, which makes them useful, but also limits what they can see.
In most cases, plugin-based tools measure things like:
- Page load times: How quickly pages render or perform from the application side.
- Visitor activity: What users view, click, or do while moving through the site.
- Database queries: How often WordPress is querying the database and whether certain actions seem heavy.
- Plugin conflicts: Signs that one plugin may be interfering with another or creating errors.
- Basic performance metrics: General indicators tied to page behavior, scripts, or site responsiveness.
That information still matters. These tools can be very helpful for things like the following:
- SEO analysis
- Page performance checks
- Content engagement metrics
- Plugin-specific diagnostics
Adding more analytics plugins creates new problems
Installing more analytics plugins might seem like the obvious fix when you feel like you’re missing visibility. In practice, though, piling on extra plugins often creates a new set of problems without solving the original one. The issue usually isn’t that you need more WordPress-level tools. It’s that WordPress-level tools can only see so much in the first place.
Every added plugin increases overhead in some form. Depending on what it does, it may add:
- More database queries: Extra tracking, logging, and reporting can increase the number of queries WordPress runs.
- Additional scripts and processing: Some plugins load assets, run background tasks, or process data on each request.
- Compatibility risk: The more plugins you stack, the greater the chance of conflicts, redundancy, or unstable behavior.
Then you’ve added on a new problem: plugin bloat. A plugin-heavy analytics setup also leads to slower load times, more maintenance, and a larger attack surface to manage.
For these reasons, adding plugin after plugin is usually a poor substitute for proper hosting-level visibility. If the missing answers reside in the infrastructure layer, trying to force more insight out of WordPress itself just adds more noise to deal with.
How hosting-level analytics reveal the full picture
Hosting-level analytics provide the context that plugin-based tools usually can’t. Instead of looking only at what happens once WordPress is already running, they show what’s happening across the hosting environment that supports every request coming into the site. That wider view is what makes them so useful when performance changes suddenly or reliability starts to slip.
Hosting analytics make those patterns visible, so you can move past symptoms and start identifying root causes. For example, a sudden slowdown during a campaign might not come from a badly coded plugin at all. It could be that traffic surged, too many uncached requests hit the server at once, and available PHP threads got tied up handling them.
In another case, page performance might dip because caching is not working as efficiently as expected, which forces the server to do more work than necessary. Those are the kinds of issues that are hard to diagnose from inside WordPress alone.
Hosting-level analytics also help teams spot patterns that would otherwise be easy to misread. If request volume is rising but much of that activity comes from bots rather than real visitors, plugin-based analytics may only show unusual traffic behavior or increased load. Hosting data gives you a clearer sense of where that traffic is coming from and how it affects server resources. That makes it easier to separate meaningful user activity from bots.
Just as important, this broader visibility speeds up troubleshooting. When teams can see the full request lifecycle, they don’t have to guess whether an issue came from WordPress, the cache layer, traffic patterns, or server pressure. They can connect what users are experiencing on the front end with what the hosting environment is doing behind the scenes immediately.
How Kinsta provides hosting-level visibility
Kinsta approaches analytics from the hosting side, not just the WordPress side. In MyKinsta, you can view operational data pulled from the hosting environment itself, which gives a clearer look at what’s happening under the hood when performance changes.
The dashboard offers company-level and site-level analytics, so teams can review usage across all sites or drill into a single environment when they need to troubleshoot something specific.
That matters because the data goes well beyond what a typical plugin can see. In MyKinsta, you can review categories like:
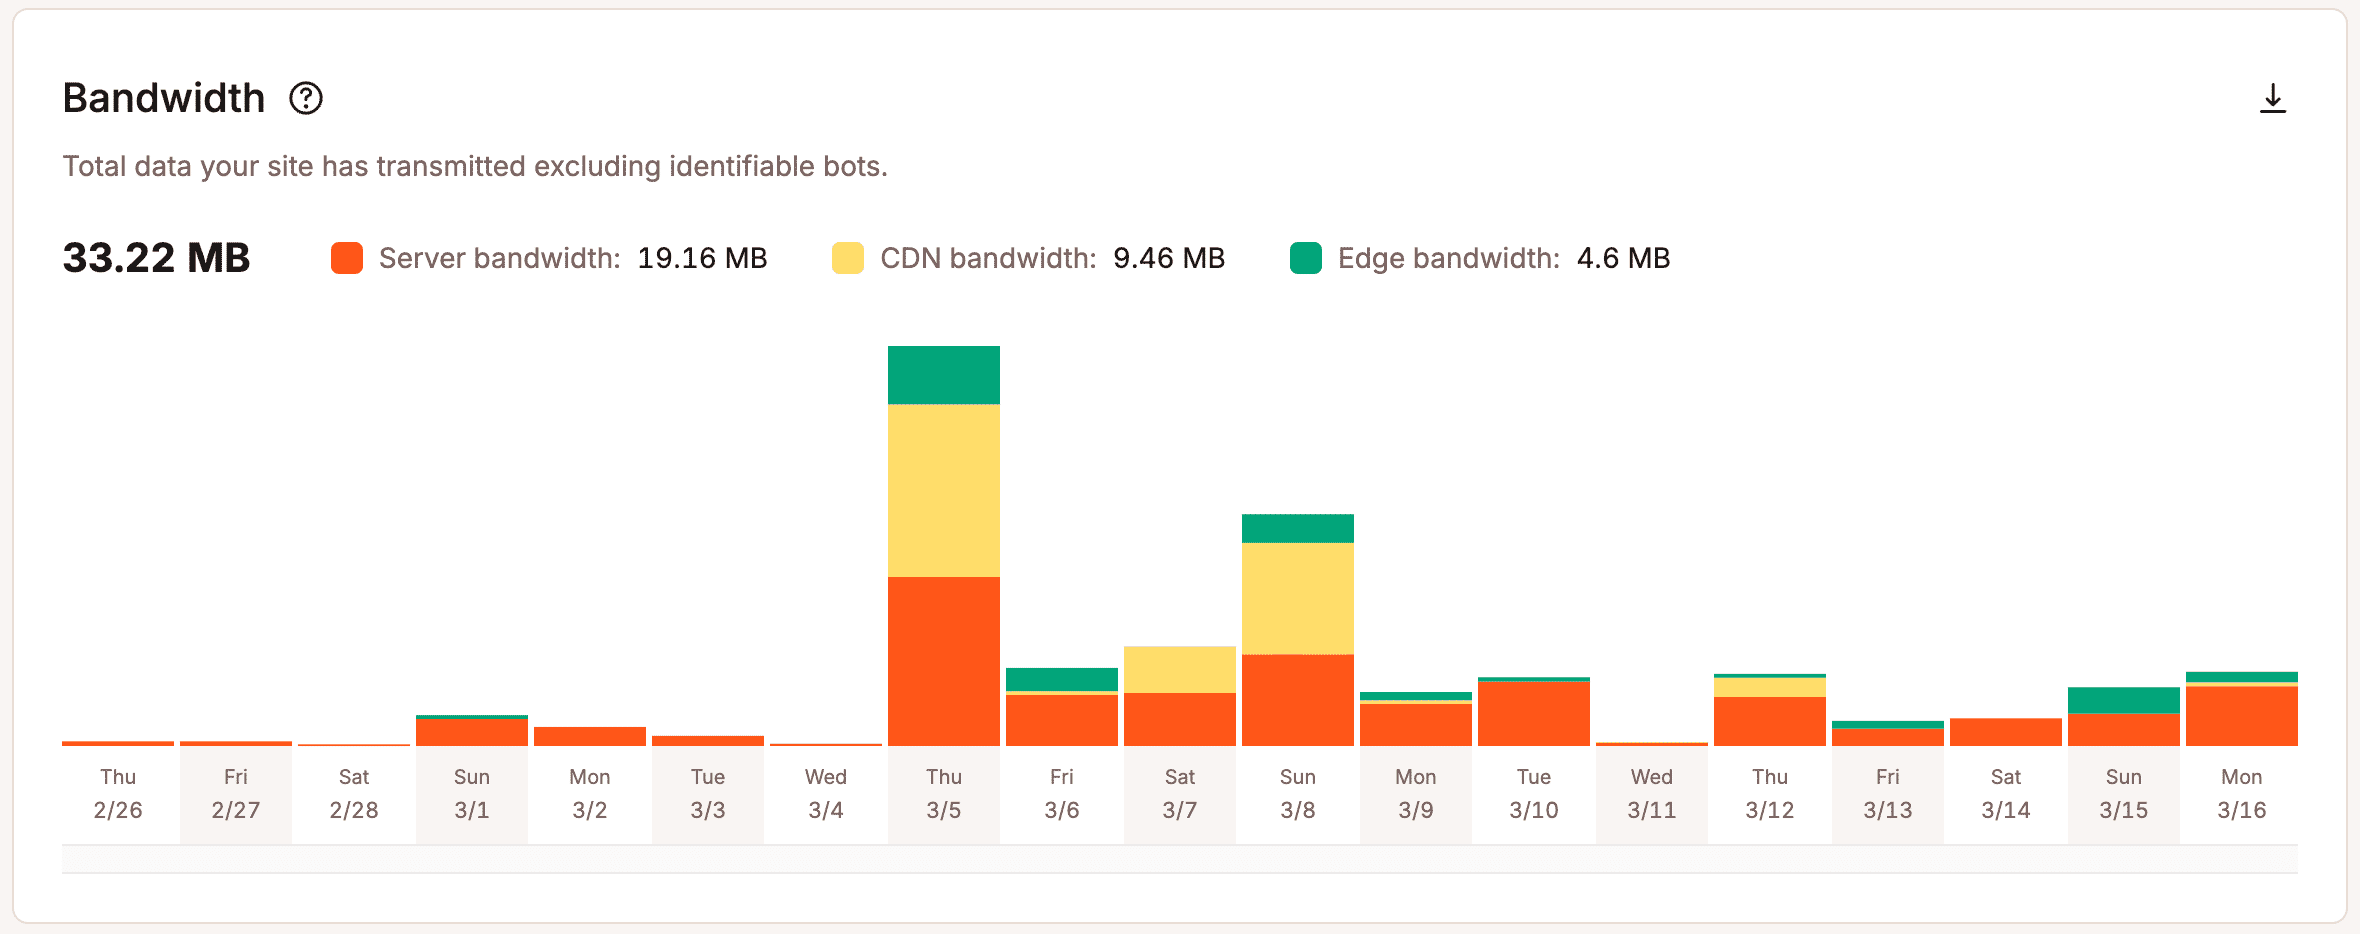
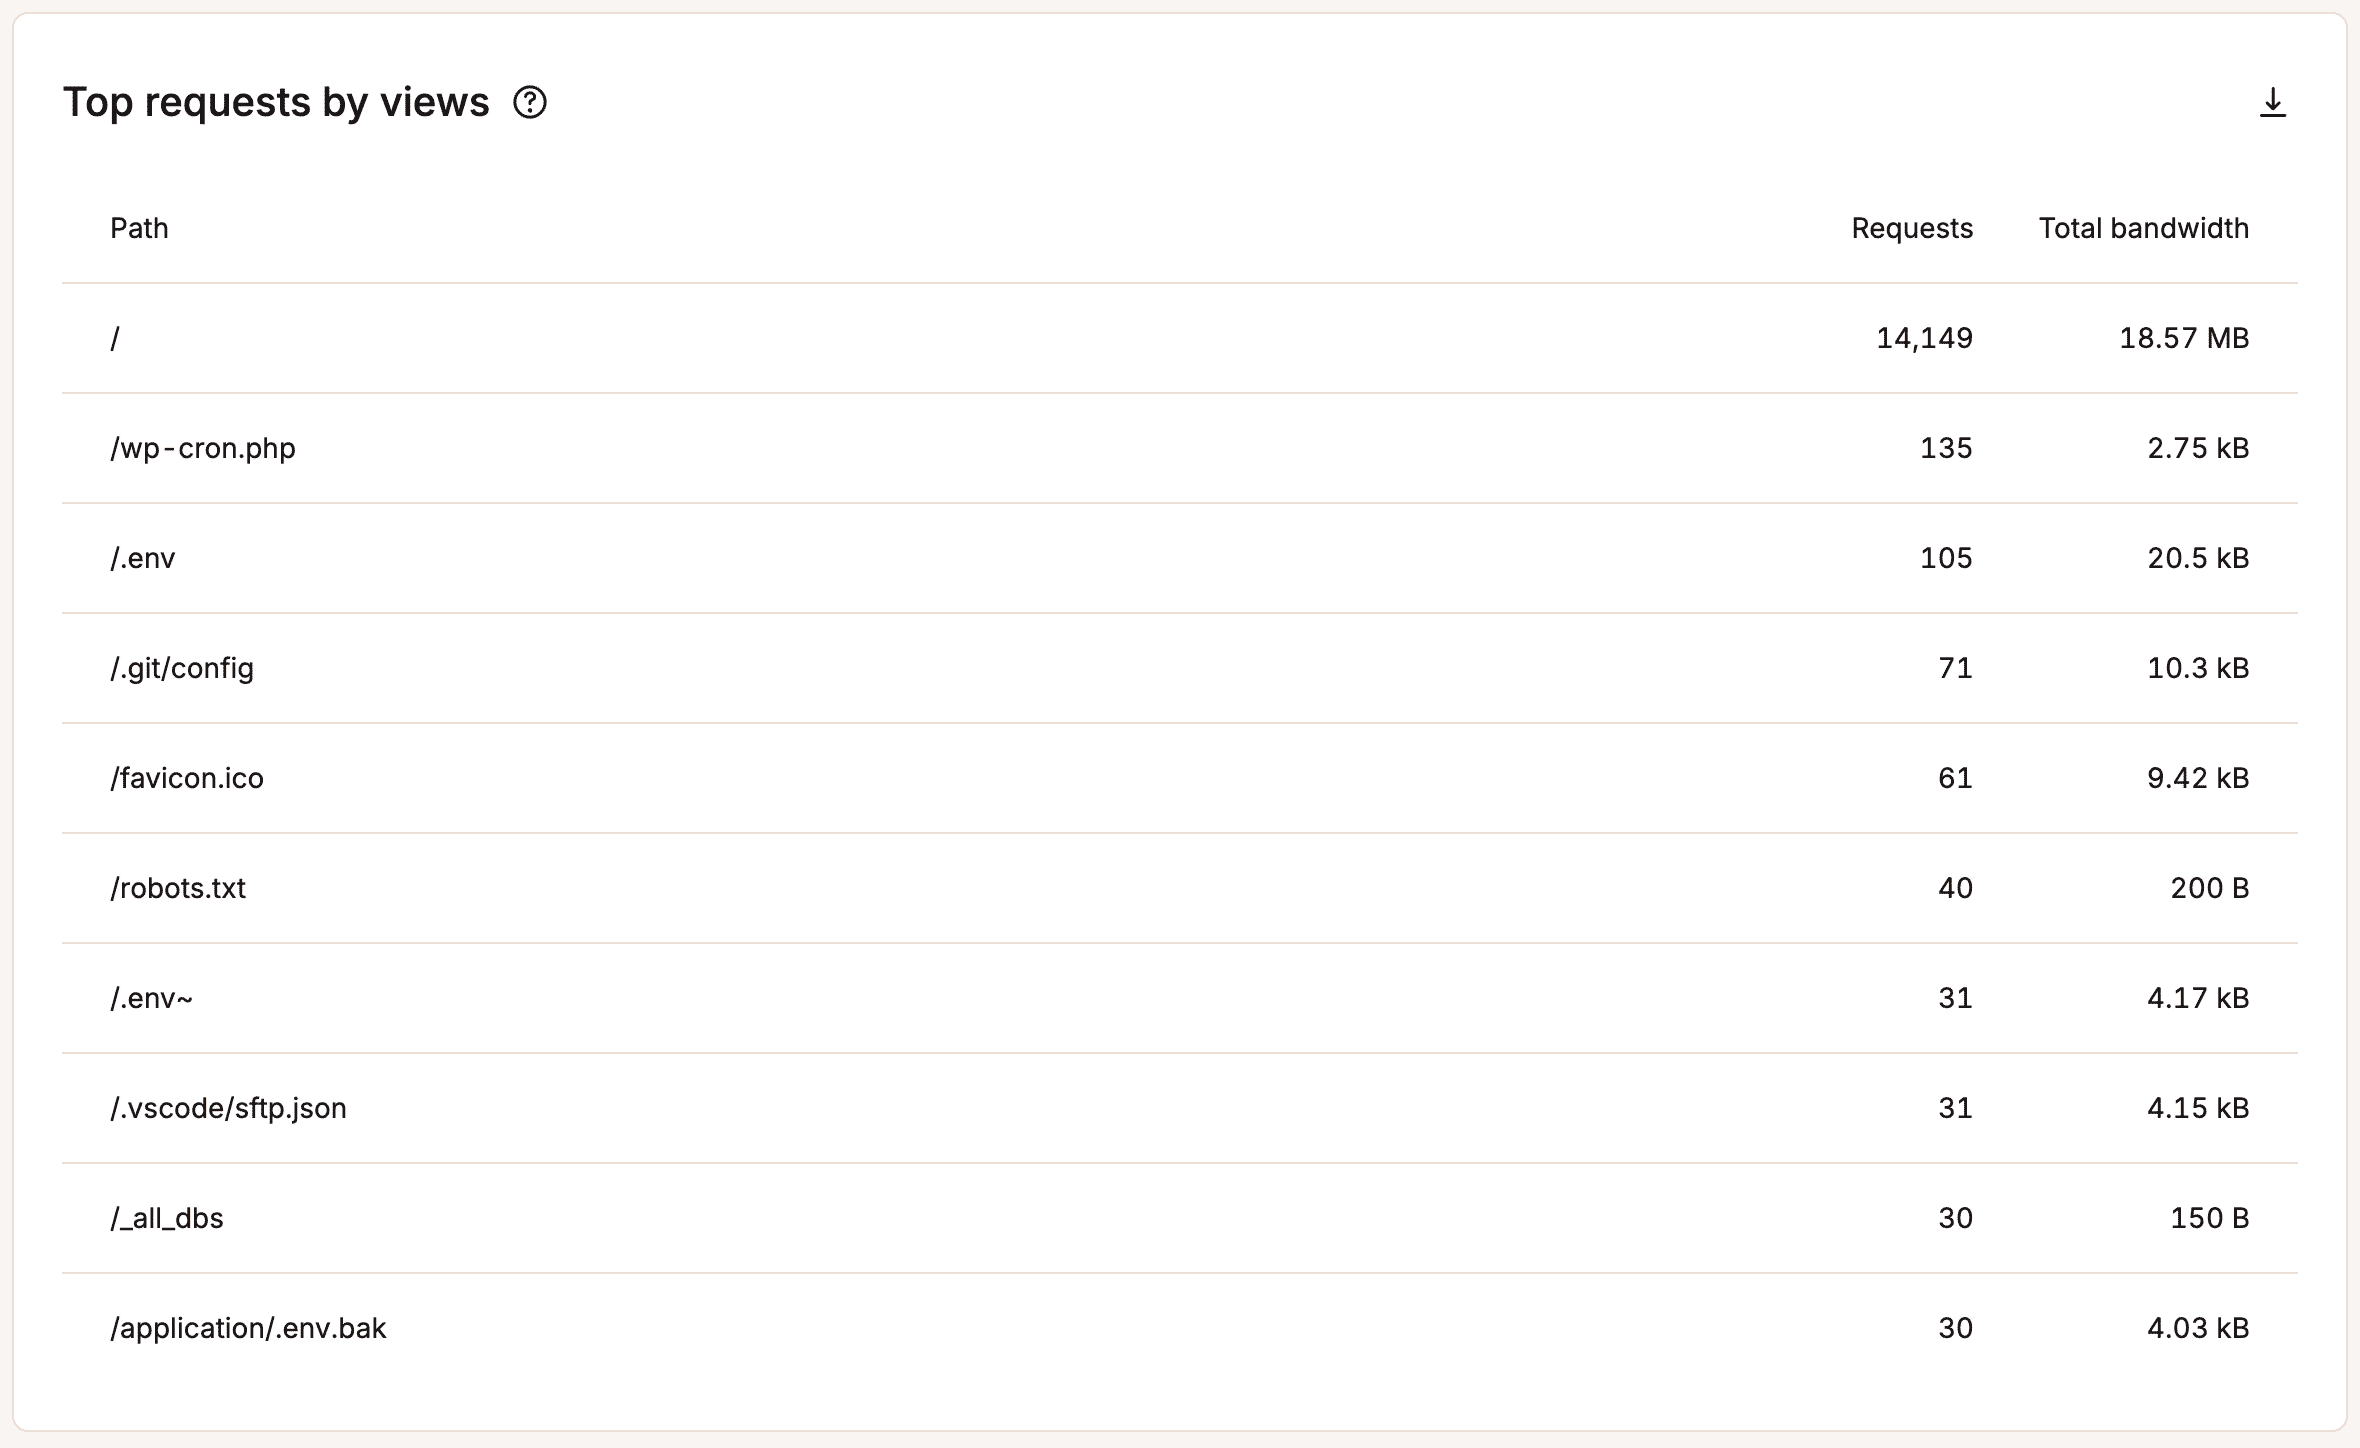
- Request analytics: Visits, bandwidth, disk space, and top requests.
- Bandwidth and traffic distribution: Server bandwidth, CDN bandwidth, edge bandwidth, and which requests consume the most resources.
- Cache performance: Cache component data and top cache bypasses.
- PHP thread usage: PHP thread limit data, along with other performance metrics like PHP throughput and average PHP and MySQL response time.
- Response codes: Response code breakdowns, error trends, redirect data, and top 404 errors.
- Geographic traffic sources: Top countries, cities, and client IPs visiting the site.
In practical terms, that gives developers, site owners, and agencies a much faster path to diagnosis. If a site slows down, you can check what’s going on, often at a glance. Top requests data can help surface suspicious request patterns tied to heavy bandwidth use, too.
That’s the real advantage here. Instead of layering on more WordPress plugins and hoping they expose the answer, Kinsta surfaces the hosting context directly inside MyKinsta.
Using plugin analytics and hosting analytics together
The point isn’t to replace plugin-based analytics. It’s to stop expecting them to do a job they were never built to do. Plugin tools and hosting analytics answer different questions, and when you use them together, you get a much more complete view of how your WordPress site is actually performing.
A simple way to think about it is this:
- Plugin analytics explain what’s happening inside WordPress. They help you track page behavior, plugin activity, database-heavy actions, and how visitors interact with your site.
- Hosting analytics explain what’s happening around WordPress. They show traffic patterns, cache behavior, response codes, PHP threads pressure, and other infrastructure conditions that shape those outcomes.
That combination is what makes troubleshooting more practical.
Say a landing page starts loading slowly. A plugin might help you spot bloated assets, a query-heavy feature, or a drop in user engagement. But hosting analytics can tell you whether the slowdown also lines up with a spike in uncached requests, poor cache efficiency, bot traffic, or resource pressure on the server. One layer shows the symptom inside the application. The other shows the operating conditions behind it.
The same logic applies to reliability issues. If errors start showing up, plugin data may help you narrow the issue to a feature, page, or recent site change. Hosting-level data can show whether those errors are part of a larger pattern tied to request surges, bandwidth shifts, response code changes, or server-side constraints. That makes it much easier to separate a true WordPress issue from a broader hosting or traffic issue.
So instead of treating plugin analytics as your main source of truth, it makes more sense to treat hosting analytics as the operational baseline. From there, plugin tools become what they’re best at: focused diagnostic aids that help you inspect the WordPress layer in more detail. Used together, they give you a clearer path from symptom to cause to fix.
Secure hosting-level visibility for your sites
Plugin-based analytics still have real value. They can help you understand how WordPress behaves, how visitors interact with your content, and where issues may appear within the application. But they are not built to show everything, and they cannot fully explain what is happening at the hosting layer underneath your site.
If you want that kind of visibility built into your hosting environment, Kinsta provides these types of analytics in the MyKinsta dashboard. They give you direct insight into the infrastructure side of WordPress management, so you can troubleshoot faster and make better decisions without relying on extra plugins to fill the gap.
Get started with a managed hosting plan from Kinsta today and see how you can take advantage of MyKinsta and many more excellent features.
The post Why hosting-level visibility matters more than plugin-based analytics appeared first on Kinsta®.